

Diagnostics
Diagnostics
EventStoreDB provides several ways to diagnose and troubleshoot issues.
- Logging: structured or plain-text logs on the console and in log files.
- Stats: stats collection and HTTP endpoint.
- Histograms: metrics collection and HTTP endpoints.
You can also use external tools to measure the performance of EventStoreDB and monitor the cluster health.
- Vector: collect metrics and logs to your APM tool using Vector.
- Prometheus exporter: collect metrics in Prometheus.
- Datadog integration: monitor and measure the cluster with Datadog.
Logging
EventStoreDB logs its internal operations to the console (stdout) and to log files. The default location of the log files and the way to change it is described below.
There are a few options to change the way how EventStoreDB produces logs and how detailed the logs should be.
Warning
The EventStoreDB logs may contain sensitive information such as stream names, user names, and projection definitions.
Log format
EventStoreDB uses the structured logging in JSON format that is more machine-friendly and can be ingested by vendor-specific tools like Logstash or Datadog agent.
Here is how the structured log looks like:
{
  "PID": "6940",
  "ThreadID": "23",
  "Date": "2020-06-16T16:14:02.052976Z",
  "Level": "Debug",
  "Logger": "ProjectionManager",
  "Message": "PROJECTIONS: Starting Projections Manager. (Node State : {state})",
  "EventProperties": {
    "state": "Master"
  }
}
{
  "PID": "6940",
  "ThreadID": "15",
  "Date": "2020-06-16T16:14:02.052976Z",
  "Level": "Info",
  "Logger": "ClusterVNodeController",
  "Message": "========== [{internalHttp}] Sub System '{subSystemName}' initialized.",
  "EventProperties": {
    "internalHttp": "127.0.0.1:2112",
    "subSystemName": "Projections"
  }
}
{
  "PID": "6940",
  "ThreadID": "23",
  "Date": "2020-06-16T16:14:02.052976Z",
  "Level": "Debug",
  "Logger": "MultiStreamMessageWriter",
  "Message": "PROJECTIONS: Resetting Worker Writer",
  "EventProperties": {}
}
{
  "PID": "6940",
  "ThreadID": "23",
  "Date": "2020-06-16T16:14:02.055000Z",
  "Level": "Debug",
  "Logger": "ProjectionCoreCoordinator",
  "Message": "PROJECTIONS: SubComponent Started: {subComponent}",
  "EventProperties": {
    "subComponent": "EventReaderCoreService"
  }
}
This format is aligned with Serilog Compact JSON format.
Logs location
Log files are located in /var/log/eventstore for Linux and macOS, and in the logs subdirectory of the EventStoreDB installation directory on Windows. You can change the log files location using the Log configuration option.
Tips
Moving logs to a separate storage might improve the database performance if you keep the default verbose log level.
| Format | Syntax |
|---|---|
| Command line | --log |
| YAML | Log |
| Environment variable | EVENTSTORE_LOG |
For example, adding this line to the eventstore.conf file will force writing logs to the /tmp/eventstore/logs directory:
Log: /tmp/eventstore/logsLog level
You can change the level using the LogLevel setting:
| Format | Syntax |
|---|---|
| Command line | --log-level |
| YAML | LogLevel |
| Environment variable | EVENTSTORE_LOG_LEVEL |
Acceptable values are: Default, Verbose, Debug, Information, Warning, Error, and Fatal.
Logging options
You can tune the EventStoreDB logging further by using the logging options described below.
Log configuration file
Specifies the location of the file which configures the logging levels of various components.
| Format | Syntax |
|---|---|
| Command line | --log-config |
| YAML | LogConfig |
| Environment variable | EVENTSTORE_LOG_CONFIG |
By default, the application directory (and /etc/eventstore on Linux and Mac) are checked. You may specify a full path.
HTTP requests logging
EventStoreDB cal also log all the incoming HTTP requests, like many HTTP servers do. Requests are logged before being processed, so unsuccessful requests are logged too.
Use one of the following ways to enable the HTTP requests logging:
| Format | Syntax |
|---|---|
| Command line | --log-http-requests |
| YAML | LogHttpRequests |
| Environment variable | EVENTSTORE_LOG_HTTP_REQUESTS |
Default: false, logging HTTP requests is disabled by default.
Log failed authentication
For security monitoring, you can enable logging failed authentication attempts by setting LogFailedAuthenticationAttempts setting to true.
| Format | Syntax |
|---|---|
| Command line | --log-failed-authentication-attempts |
| YAML | LogFailedAuthenticationAttempts |
| Environment variable | EVENTSTORE_LOG_FAILED_AUTHENTICATION_ATTEMPTS |
Default: false
Log console format
The format of the console logger. Use Json for structured log output.
| Format | Syntax |
|---|---|
| Command line | --log-console-format |
| YAML | LogConsoleFormat |
| Environment variable | EVENTSTORE_LOG_CONSOLE_FORMAT |
Acceptable values are: Plain, Json
Default: Plain
Log file size
The maximum size of each log file, in bytes.
| Format | Syntax |
|---|---|
| Command line | --log-file-size |
| YAML | LogFileSize |
| Environment variable | EVENTSTORE_LOG_FILE_SIZE |
Default: 1GB
Log file interval
How often to rotate logs.
| Format | Syntax |
|---|---|
| Command line | --log-file-interval |
| YAML | LogFileInterval |
| Environment variable | EVENTSTORE_LOG_FILE_INTERVAL |
Acceptable values are: Minute, Hour, Day, Week, Month, Year
Default: Day
Log file retention count
How many log files to hold on to.
| Format | Syntax |
|---|---|
| Command line | --log-file-retention-count |
| YAML | LogFileRetentionCount |
| Environment variable | EVENTSTORE_LOG_RETENTION_COUNT |
Default: 31
Disable log file
You can completely disable logging to a file by changing the DisableLogFile option.
| Format | Syntax |
|---|---|
| Command line | --disable-log-file |
| YAML | DisableLogFile |
| Environment variable | EVENTSTORE_DISABLE_LOG_FILE |
Default: false
Statistics
EventStoreDB servers collect internal statistics and make it available via HTTP over the https://<host>:2113/stats in JSON format. Here, 2113 is the default HTTP port. Monitoring applications and metric collectors can use this endpoint to gather the information about the cluster node. The stats endpoint only exposes information about the node where you fetch it from and doesn't contain any cluster information.
What you see in the stats endpoint response is the last collected state of the server. The server collects this information using events that are appended to the statistics stream. Each node has one. We use a reserved name for the stats stream, $stats-<host:port>. For example, for a single node running locally the stream name would be $stats-127.0.0.1:2113.
As all other events, stats events are also linked in the $all stream. These events have a reserved event type $statsCollected.
Click here to see an example of a stats event
{
  "proc-startTime": "2020-06-25T10:13:26.8281750Z",
  "proc-id": 5465,
  "proc-mem": 118648832,
  "proc-cpu": 2.44386363,
  "proc-cpuScaled": 0.152741477,
  "proc-threadsCount": 10,
  "proc-contentionsRate": 0.9012223,
  "proc-thrownExceptionsRate": 0.0,
  "sys-cpu": 100.0,
  "sys-freeMem": 25100288,
  "proc-gc-allocationSpeed": 0.0,
  "proc-gc-gen0ItemsCount": 8,
  "proc-gc-gen0Size": 0,
  "proc-gc-gen1ItemsCount": 2,
  "proc-gc-gen1Size": 0,
  "proc-gc-gen2ItemsCount": 0,
  "proc-gc-gen2Size": 0,
  "proc-gc-largeHeapSize": 0,
  "proc-gc-timeInGc": 0.0,
  "proc-gc-totalBytesInHeaps": 0,
  "proc-tcp-connections": 0,
  "proc-tcp-receivingSpeed": 0.0,
  "proc-tcp-sendingSpeed": 0.0,
  "proc-tcp-inSend": 0,
  "proc-tcp-measureTime": "00:00:19.0534210",
  "proc-tcp-pendingReceived": 0,
  "proc-tcp-pendingSend": 0,
  "proc-tcp-receivedBytesSinceLastRun": 0,
  "proc-tcp-receivedBytesTotal": 0,
  "proc-tcp-sentBytesSinceLastRun": 0,
  "proc-tcp-sentBytesTotal": 0,
  "es-checksum": 1613144,
  "es-checksumNonFlushed": 1613144,
  "sys-drive-/System/Volumes/Data-availableBytes": 545628151808,
  "sys-drive-/System/Volumes/Data-totalBytes": 2000481927168,
  "sys-drive-/System/Volumes/Data-usage": "72%",
  "sys-drive-/System/Volumes/Data-usedBytes": 1454853775360,
  "es-queue-Index Committer-queueName": "Index Committer",
  "es-queue-Index Committer-groupName": "",
  "es-queue-Index Committer-avgItemsPerSecond": 0,
  "es-queue-Index Committer-avgProcessingTime": 0.0,
  "es-queue-Index Committer-currentIdleTime": "0:00:00:29.9895180",
  "es-queue-Index Committer-currentItemProcessingTime": null,
  "es-queue-Index Committer-idleTimePercent": 100.0,
  "es-queue-Index Committer-length": 0,
  "es-queue-Index Committer-lengthCurrentTryPeak": 0,
  "es-queue-Index Committer-lengthLifetimePeak": 0,
  "es-queue-Index Committer-totalItemsProcessed": 0,
  "es-queue-Index Committer-inProgressMessage": "<none>",
  "es-queue-Index Committer-lastProcessedMessage": "<none>",
  "es-queue-MainQueue-queueName": "MainQueue",
  "es-queue-MainQueue-groupName": "",
  "es-queue-MainQueue-avgItemsPerSecond": 14,
  "es-queue-MainQueue-avgProcessingTime": 0.0093527972027972021,
  "es-queue-MainQueue-currentIdleTime": "0:00:00:00.8050567",
  "es-queue-MainQueue-currentItemProcessingTime": null,
  "es-queue-MainQueue-idleTimePercent": 99.986616840364917,
  "es-queue-MainQueue-length": 0,
  "es-queue-MainQueue-lengthCurrentTryPeak": 3,
  "es-queue-MainQueue-lengthLifetimePeak": 6,
  "es-queue-MainQueue-totalItemsProcessed": 452,
  "es-queue-MainQueue-inProgressMessage": "<none>",
  "es-queue-MainQueue-lastProcessedMessage": "Schedule",
  "es-queue-MonitoringQueue-queueName": "MonitoringQueue",
  "es-queue-MonitoringQueue-groupName": "",
  "es-queue-MonitoringQueue-avgItemsPerSecond": 0,
  "es-queue-MonitoringQueue-avgProcessingTime": 1.94455,
  "es-queue-MonitoringQueue-currentIdleTime": "0:00:00:19.0601186",
  "es-queue-MonitoringQueue-currentItemProcessingTime": null,
  "es-queue-MonitoringQueue-idleTimePercent": 99.980537727681721,
  "es-queue-MonitoringQueue-length": 0,
  "es-queue-MonitoringQueue-lengthCurrentTryPeak": 0,
  "es-queue-MonitoringQueue-lengthLifetimePeak": 0,
  "es-queue-MonitoringQueue-totalItemsProcessed": 14,
  "es-queue-MonitoringQueue-inProgressMessage": "<none>",
  "es-queue-MonitoringQueue-lastProcessedMessage": "GetFreshTcpConnectionStats",
  "es-queue-PersistentSubscriptions-queueName": "PersistentSubscriptions",
  "es-queue-PersistentSubscriptions-groupName": "",
  "es-queue-PersistentSubscriptions-avgItemsPerSecond": 1,
  "es-queue-PersistentSubscriptions-avgProcessingTime": 0.010400000000000001,
  "es-queue-PersistentSubscriptions-currentIdleTime": "0:00:00:00.8052015",
  "es-queue-PersistentSubscriptions-currentItemProcessingTime": null,
  "es-queue-PersistentSubscriptions-idleTimePercent": 99.998954276430226,
  "es-queue-PersistentSubscriptions-length": 0,
  "es-queue-PersistentSubscriptions-lengthCurrentTryPeak": 0,
  "es-queue-PersistentSubscriptions-lengthLifetimePeak": 0,
  "es-queue-PersistentSubscriptions-totalItemsProcessed": 32,
  "es-queue-PersistentSubscriptions-inProgressMessage": "<none>",
  "es-queue-PersistentSubscriptions-lastProcessedMessage": "PersistentSubscriptionTimerTick",
  "es-queue-Projection Core #0-queueName": "Projection Core #0",
  "es-queue-Projection Core #0-groupName": "Projection Core",
  "es-queue-Projection Core #0-avgItemsPerSecond": 0,
  "es-queue-Projection Core #0-avgProcessingTime": 0.0,
  "es-queue-Projection Core #0-currentIdleTime": "0:00:00:29.9480513",
  "es-queue-Projection Core #0-currentItemProcessingTime": null,
  "es-queue-Projection Core #0-idleTimePercent": 100.0,
  "es-queue-Projection Core #0-length": 0,
  "es-queue-Projection Core #0-lengthCurrentTryPeak": 0,
  "es-queue-Projection Core #0-lengthLifetimePeak": 0,
  "es-queue-Projection Core #0-totalItemsProcessed": 2,
  "es-queue-Projection Core #0-inProgressMessage": "<none>",
  "es-queue-Projection Core #0-lastProcessedMessage": "SubComponentStarted",
  "es-queue-Projections Master-queueName": "Projections Master",
  "es-queue-Projections Master-groupName": "",
  "es-queue-Projections Master-avgItemsPerSecond": 0,
  "es-queue-Projections Master-avgProcessingTime": 0.0,
  "es-queue-Projections Master-currentIdleTime": "0:00:00:29.8467445",
  "es-queue-Projections Master-currentItemProcessingTime": null,
  "es-queue-Projections Master-idleTimePercent": 100.0,
  "es-queue-Projections Master-length": 0,
  "es-queue-Projections Master-lengthCurrentTryPeak": 0,
  "es-queue-Projections Master-lengthLifetimePeak": 3,
  "es-queue-Projections Master-totalItemsProcessed": 10,
  "es-queue-Projections Master-inProgressMessage": "<none>",
  "es-queue-Projections Master-lastProcessedMessage": "RegularTimeout",
  "es-queue-Storage Chaser-queueName": "Storage Chaser",
  "es-queue-Storage Chaser-groupName": "",
  "es-queue-Storage Chaser-avgItemsPerSecond": 94,
  "es-queue-Storage Chaser-avgProcessingTime": 0.0043385023898035047,
  "es-queue-Storage Chaser-currentIdleTime": "0:00:00:00.0002530",
  "es-queue-Storage Chaser-currentItemProcessingTime": null,
  "es-queue-Storage Chaser-idleTimePercent": 99.959003031702224,
  "es-queue-Storage Chaser-length": 0,
  "es-queue-Storage Chaser-lengthCurrentTryPeak": 0,
  "es-queue-Storage Chaser-lengthLifetimePeak": 0,
  "es-queue-Storage Chaser-totalItemsProcessed": 2835,
  "es-queue-Storage Chaser-inProgressMessage": "<none>",
  "es-queue-Storage Chaser-lastProcessedMessage": "ChaserCheckpointFlush",
  "es-queue-StorageReaderQueue #1-queueName": "StorageReaderQueue #1",
  "es-queue-StorageReaderQueue #1-groupName": "StorageReaderQueue",
  "es-queue-StorageReaderQueue #1-avgItemsPerSecond": 0,
  "es-queue-StorageReaderQueue #1-avgProcessingTime": 0.22461000000000003,
  "es-queue-StorageReaderQueue #1-currentIdleTime": "0:00:00:00.9863988",
  "es-queue-StorageReaderQueue #1-currentItemProcessingTime": null,
  "es-queue-StorageReaderQueue #1-idleTimePercent": 99.988756844383616,
  "es-queue-StorageReaderQueue #1-length": 0,
  "es-queue-StorageReaderQueue #1-lengthCurrentTryPeak": 0,
  "es-queue-StorageReaderQueue #1-lengthLifetimePeak": 0,
  "es-queue-StorageReaderQueue #1-totalItemsProcessed": 15,
  "es-queue-StorageReaderQueue #1-inProgressMessage": "<none>",
  "es-queue-StorageReaderQueue #1-lastProcessedMessage": "ReadStreamEventsBackward",
  "es-queue-StorageReaderQueue #2-queueName": "StorageReaderQueue #2",
  "es-queue-StorageReaderQueue #2-groupName": "StorageReaderQueue",
  "es-queue-StorageReaderQueue #2-avgItemsPerSecond": 0,
  "es-queue-StorageReaderQueue #2-avgProcessingTime": 8.83216,
  "es-queue-StorageReaderQueue #2-currentIdleTime": "0:00:00:00.8051068",
  "es-queue-StorageReaderQueue #2-currentItemProcessingTime": null,
  "es-queue-StorageReaderQueue #2-idleTimePercent": 99.557874170777851,
  "es-queue-StorageReaderQueue #2-length": 0,
  "es-queue-StorageReaderQueue #2-lengthCurrentTryPeak": 0,
  "es-queue-StorageReaderQueue #2-lengthLifetimePeak": 0,
  "es-queue-StorageReaderQueue #2-totalItemsProcessed": 16,
  "es-queue-StorageReaderQueue #2-inProgressMessage": "<none>",
  "es-queue-StorageReaderQueue #2-lastProcessedMessage": "ReadStreamEventsForward",
  "es-queue-StorageReaderQueue #3-queueName": "StorageReaderQueue #3",
  "es-queue-StorageReaderQueue #3-groupName": "StorageReaderQueue",
  "es-queue-StorageReaderQueue #3-avgItemsPerSecond": 0,
  "es-queue-StorageReaderQueue #3-avgProcessingTime": 6.4189888888888893,
  "es-queue-StorageReaderQueue #3-currentIdleTime": "0:00:00:02.8228372",
  "es-queue-StorageReaderQueue #3-currentItemProcessingTime": null,
  "es-queue-StorageReaderQueue #3-idleTimePercent": 99.710808119472517,
  "es-queue-StorageReaderQueue #3-length": 0,
  "es-queue-StorageReaderQueue #3-lengthCurrentTryPeak": 0,
  "es-queue-StorageReaderQueue #3-lengthLifetimePeak": 0,
  "es-queue-StorageReaderQueue #3-totalItemsProcessed": 14,
  "es-queue-StorageReaderQueue #3-inProgressMessage": "<none>",
  "es-queue-StorageReaderQueue #3-lastProcessedMessage": "ReadStreamEventsForward",
  "es-queue-StorageReaderQueue #4-queueName": "StorageReaderQueue #4",
  "es-queue-StorageReaderQueue #4-groupName": "StorageReaderQueue",
  "es-queue-StorageReaderQueue #4-avgItemsPerSecond": 0,
  "es-queue-StorageReaderQueue #4-avgProcessingTime": 0.36447,
  "es-queue-StorageReaderQueue #4-currentIdleTime": "0:00:00:01.8144419",
  "es-queue-StorageReaderQueue #4-currentItemProcessingTime": null,
  "es-queue-StorageReaderQueue #4-idleTimePercent": 99.981747643099709,
  "es-queue-StorageReaderQueue #4-length": 0,
  "es-queue-StorageReaderQueue #4-lengthCurrentTryPeak": 0,
  "es-queue-StorageReaderQueue #4-lengthLifetimePeak": 0,
  "es-queue-StorageReaderQueue #4-totalItemsProcessed": 14,
  "es-queue-StorageReaderQueue #4-inProgressMessage": "<none>",
  "es-queue-StorageReaderQueue #4-lastProcessedMessage": "ReadStreamEventsForward",
  "es-queue-StorageWriterQueue-queueName": "StorageWriterQueue",
  "es-queue-StorageWriterQueue-groupName": "",
  "es-queue-StorageWriterQueue-avgItemsPerSecond": 0,
  "es-queue-StorageWriterQueue-avgProcessingTime": 0.0,
  "es-queue-StorageWriterQueue-currentIdleTime": "0:00:00:29.9437790",
  "es-queue-StorageWriterQueue-currentItemProcessingTime": null,
  "es-queue-StorageWriterQueue-idleTimePercent": 100.0,
  "es-queue-StorageWriterQueue-length": 0,
  "es-queue-StorageWriterQueue-lengthCurrentTryPeak": 0,
  "es-queue-StorageWriterQueue-lengthLifetimePeak": 0,
  "es-queue-StorageWriterQueue-totalItemsProcessed": 6,
  "es-queue-StorageWriterQueue-inProgressMessage": "<none>",
  "es-queue-StorageWriterQueue-lastProcessedMessage": "WritePrepares",
  "es-queue-Subscriptions-queueName": "Subscriptions",
  "es-queue-Subscriptions-groupName": "",
  "es-queue-Subscriptions-avgItemsPerSecond": 1,
  "es-queue-Subscriptions-avgProcessingTime": 0.057019047619047622,
  "es-queue-Subscriptions-currentIdleTime": "0:00:00:00.8153708",
  "es-queue-Subscriptions-currentItemProcessingTime": null,
  "es-queue-Subscriptions-idleTimePercent": 99.993992971356,
  "es-queue-Subscriptions-length": 0,
  "es-queue-Subscriptions-lengthCurrentTryPeak": 0,
  "es-queue-Subscriptions-lengthLifetimePeak": 0,
  "es-queue-Subscriptions-totalItemsProcessed": 31,
  "es-queue-Subscriptions-inProgressMessage": "<none>",
  "es-queue-Subscriptions-lastProcessedMessage": "CheckPollTimeout",
  "es-queue-Timer-queueName": "Timer",
  "es-queue-Timer-groupName": "",
  "es-queue-Timer-avgItemsPerSecond": 14,
  "es-queue-Timer-avgProcessingTime": 0.038568989547038329,
  "es-queue-Timer-currentIdleTime": "0:00:00:00.0002752",
  "es-queue-Timer-currentItemProcessingTime": null,
  "es-queue-Timer-idleTimePercent": 99.94364205726194,
  "es-queue-Timer-length": 17,
  "es-queue-Timer-lengthCurrentTryPeak": 17,
  "es-queue-Timer-lengthLifetimePeak": 17,
  "es-queue-Timer-totalItemsProcessed": 419,
  "es-queue-Timer-inProgressMessage": "<none>",
  "es-queue-Timer-lastProcessedMessage": "ExecuteScheduledTasks",
  "es-queue-Worker #1-queueName": "Worker #1",
  "es-queue-Worker #1-groupName": "Workers",
  "es-queue-Worker #1-avgItemsPerSecond": 2,
  "es-queue-Worker #1-avgProcessingTime": 0.076058695652173922,
  "es-queue-Worker #1-currentIdleTime": "0:00:00:00.8050943",
  "es-queue-Worker #1-currentItemProcessingTime": null,
  "es-queue-Worker #1-idleTimePercent": 99.982484504768721,
  "es-queue-Worker #1-length": 0,
  "es-queue-Worker #1-lengthCurrentTryPeak": 0,
  "es-queue-Worker #1-lengthLifetimePeak": 0,
  "es-queue-Worker #1-totalItemsProcessed": 73,
  "es-queue-Worker #1-inProgressMessage": "<none>",
  "es-queue-Worker #1-lastProcessedMessage": "ReadStreamEventsForwardCompleted",
  "es-queue-Worker #2-queueName": "Worker #2",
  "es-queue-Worker #2-groupName": "Workers",
  "es-queue-Worker #2-avgItemsPerSecond": 2,
  "es-queue-Worker #2-avgProcessingTime": 0.19399347826086957,
  "es-queue-Worker #2-currentIdleTime": "0:00:00:00.8356863",
  "es-queue-Worker #2-currentItemProcessingTime": null,
  "es-queue-Worker #2-idleTimePercent": 99.955350254886739,
  "es-queue-Worker #2-length": 0,
  "es-queue-Worker #2-lengthCurrentTryPeak": 0,
  "es-queue-Worker #2-lengthLifetimePeak": 0,
  "es-queue-Worker #2-totalItemsProcessed": 69,
  "es-queue-Worker #2-inProgressMessage": "<none>",
  "es-queue-Worker #2-lastProcessedMessage": "PurgeTimedOutRequests",
  "es-queue-Worker #3-queueName": "Worker #3",
  "es-queue-Worker #3-groupName": "Workers",
  "es-queue-Worker #3-avgItemsPerSecond": 2,
  "es-queue-Worker #3-avgProcessingTime": 0.068475555555555567,
  "es-queue-Worker #3-currentIdleTime": "0:00:00:00.8356754",
  "es-queue-Worker #3-currentItemProcessingTime": null,
  "es-queue-Worker #3-idleTimePercent": 99.984583460721979,
  "es-queue-Worker #3-length": 0,
  "es-queue-Worker #3-lengthCurrentTryPeak": 0,
  "es-queue-Worker #3-lengthLifetimePeak": 0,
  "es-queue-Worker #3-totalItemsProcessed": 68,
  "es-queue-Worker #3-inProgressMessage": "<none>",
  "es-queue-Worker #3-lastProcessedMessage": "PurgeTimedOutRequests",
  "es-queue-Worker #4-queueName": "Worker #4",
  "es-queue-Worker #4-groupName": "Workers",
  "es-queue-Worker #4-avgItemsPerSecond": 2,
  "es-queue-Worker #4-avgProcessingTime": 0.040221428571428575,
  "es-queue-Worker #4-currentIdleTime": "0:00:00:00.8356870",
  "es-queue-Worker #4-currentItemProcessingTime": null,
  "es-queue-Worker #4-idleTimePercent": 99.99154911144629,
  "es-queue-Worker #4-length": 0,
  "es-queue-Worker #4-lengthCurrentTryPeak": 0,
  "es-queue-Worker #4-lengthLifetimePeak": 0,
  "es-queue-Worker #4-totalItemsProcessed": 65,
  "es-queue-Worker #4-inProgressMessage": "<none>",
  "es-queue-Worker #4-lastProcessedMessage": "PurgeTimedOutRequests",
  "es-queue-Worker #5-queueName": "Worker #5",
  "es-queue-Worker #5-groupName": "Workers",
  "es-queue-Worker #5-avgItemsPerSecond": 2,
  "es-queue-Worker #5-avgProcessingTime": 0.17759268292682928,
  "es-queue-Worker #5-currentIdleTime": "0:00:00:00.8052165",
  "es-queue-Worker #5-currentItemProcessingTime": null,
  "es-queue-Worker #5-idleTimePercent": 99.9635548548067,
  "es-queue-Worker #5-length": 0,
  "es-queue-Worker #5-lengthCurrentTryPeak": 0,
  "es-queue-Worker #5-lengthLifetimePeak": 0,
  "es-queue-Worker #5-totalItemsProcessed": 70,
  "es-queue-Worker #5-inProgressMessage": "<none>",
  "es-queue-Worker #5-lastProcessedMessage": "IODispatcherDelayedMessage",
  "es-writer-lastFlushSize": 0,
  "es-writer-lastFlushDelayMs": 0.0134,
  "es-writer-meanFlushSize": 0,
  "es-writer-meanFlushDelayMs": 0.0134,
  "es-writer-maxFlushSize": 0,
  "es-writer-maxFlushDelayMs": 0.0134,
  "es-writer-queuedFlushMessages": 0,
  "es-readIndex-cachedRecord": 676,
  "es-readIndex-notCachedRecord": 0,
  "es-readIndex-cachedStreamInfo": 171,
  "es-readIndex-notCachedStreamInfo": 32,
  "es-readIndex-cachedTransInfo": 0,
  "es-readIndex-notCachedTransInfo": 0
}
Stats stream has the max time-to-live set to 24 hours, so all the events that are older than 24 hours will be deleted.
Stats period
Using this setting you can control how often stats events are generated. By default, the node will produce one event in 30 seconds. If you want to decrease network pressure on subscribers to the $all stream, you can tell EventStoreDB to produce stats less often.
| Format | Syntax |
|---|---|
| Command line | --stats-period-sec |
| YAML | StatsPeriodSec |
| Environment variable | EVENTSTORE_STATS_PERIOD_SEC |
Default: 30
Write stats to database
As mentioned before, stats events are quite large and whilst it is sometimes beneficial to keep the stats history, it is most of the time not necessary. Therefore, we do not write stats events to the database by default. When this option is set to true, all the stats events will be persisted.
As mentioned before, stats events have a TTL of 24 hours and when writing stats to the database is enabled, you'd need to scavenge more often to release the disk space.
| Format | Syntax |
|---|---|
| Command line | --write-stats-to-db |
| YAML | WriteStatsToDb |
| Environment variable | EVENTSTORE_WRITE_STATS_TO_DB |
Default: false
Histograms
Histograms give a distribution in percentiles of the time spent on several metrics. This can be used to diagnose issues in the system. It is not recommended enabling this in production environment. When enabled, histogram stats are available at their corresponding http endpoints.
For example, you could ask for a stream reader histograms like this:
curl http://localhost:2113/histogram/reader-streamrange -u admin:changeitThat would give a response with the stats distributed across histogram buckets:
   Value     Percentile TotalCount 1/(1-Percentile)

   0.022 0.000000000000          1           1.00
   0.044 0.100000000000         30           1.11
   0.054 0.200000000000         59           1.25
   0.074 0.300000000000         88           1.43
   0.092 0.400000000000        118           1.67
   0.108 0.500000000000        147           2.00
   0.113 0.550000000000        162           2.22
   0.127 0.600000000000        176           2.50
   0.140 0.650000000000        191           2.86
   0.155 0.700000000000        206           3.33
   0.168 0.750000000000        220           4.00
   0.179 0.775000000000        228           4.44
   0.197 0.800000000000        235           5.00
   0.219 0.825000000000        242           5.71
   0.232 0.850000000000        250           6.67
   0.277 0.875000000000        257           8.00
   0.327 0.887500000000        261           8.89
   0.346 0.900000000000        264          10.00
   0.522 0.912500000000        268          11.43
   0.836 0.925000000000        272          13.33
   0.971 0.937500000000        275          16.00
   1.122 0.943750000000        277          17.78
   1.153 0.950000000000        279          20.00
   1.217 0.956250000000        281          22.86
   2.836 0.962500000000        283          26.67
   2.972 0.968750000000        284          32.00
   3.607 0.971875000000        285          35.56
   4.964 0.975000000000        286          40.00
   8.536 0.978125000000        287          45.71
  11.035 0.981250000000        288          53.33
  11.043 0.984375000000        289          64.00
  11.043 0.985937500000        289          71.11
  34.013 0.987500000000        290          80.00
  34.013 0.989062500000        290          91.43
  41.812 0.990625000000        292         106.67
  41.812 0.992187500000        292         128.00
  41.812 0.992968750000        292         142.22
  41.812 0.993750000000        292         160.00
  41.812 0.994531250000        292         182.86
  41.812 0.995312500000        292         213.33
  41.812 0.996093750000        292         256.00
  41.812 0.996484375000        292         284.44
  41.878 0.996875000000        293         320.00
  41.878 1.000000000000        293

#[Mean = 0.854, StdDeviation = 4.739]
#[Max = 41.878, Total count = 293]
#[Buckets = 20, SubBuckets = 2048]
Reading histograms
The histogram response tells you some useful metrics like mean, max, standard deviation and also that in 99% of cases reads take about 41.8ms, as in the example above.
Using histograms
You can enable histograms in a development environment and run a specific task to see how it affects the database, telling you where and how the time is spent.
Execute a GET HTTP call to a cluster node using the http://<node>:2113/histogram/<metric> path to get a response. Here 2113 is the default external HTTP port.
Available metrics
| Endpoint | Measures time spent |
|---|---|
reader-streamrange | ReadStreamEventsForward and ReadStreamEventsBackwards |
writer-flush | Flushing to disk in the storage writer service |
chaser-wait and chaser-flush | Storage chaser |
reader-readevent | Checking the stream access and reading an event |
reader-allrange | ReadAllEventsForward and ReadAllEventsBackward |
request-manager | --- |
tcp-send | Sending messages over TCP |
http-send | Sending messages over HTTP |
Enabling histograms
Use the option described below to enable histograms. Because collecting histograms uses CPU resources, they are disabled by default.
| Format | Syntax |
|---|---|
| Command line | --enable-histograms |
| YAML | EnableHistograms |
| Environment variable | EVENTSTORE_ENABLE_HISTOGRAMS |
Default: false
Vector
Vector is a lightweight and ultra-fast tool for building observability pipelines. (from Vector website)
You can use Vector for extracting metrics or logs from your self-managed EventStore server.
It's also possible to collect metrics from the Event Store Cloud managed cluster or instance, as long as the Vector agent is running on a machine that has a direct connection to the EventStoreDB server. You cannot, however, fetch logs from Event Store Cloud using your own Vector agent.
Installation
Follow the installation instructions provided by Vector to deploy the agent. You can deploy and run it on the same machine where you run EventStoreDB server. If you run EventStoreDB in Kubernetes, you can run Vector as a sidecar for each of the EventStoreDB pods.
Configuration
Each Vector instance needs to be configured with sources and sinks. When configured properly, it will collect information from each source, apply the necessary transformation (if needed), and send the transformed information to the configured sink.
Vector provides many different sinks, you most probably will find your preferred monitoring platform among those sinks.
Collecting metrics
There is an official EventStoreDB source that you can use to pull relevant metrics from your database.
Below you can find an example that you can use in your vector.toml configuration file:
[sources.eventstoredb_metrics]
type = "eventstoredb_metrics"
endpoint = "https://{hostname}:{http_port}/stats"
scrape_interval_secs = 3
Here hostname is the EventStoreDB node hostname or the cluster DNS name, and http_port is the configured HTTP port, which is 2113 by default.
Collecting logs
To collect logs, you can use the file source and configure it to target EventStoreDB log file. For log collection, Vector must run on the same machine as EventStoreDB server as it collects the logs from files on the local file system.
[sources.eventstoredb_logs]
type = "file"
# If you changed the default log location, please update the filepath accordingly.
include = ["/var/log/eventstore"]
read_from = "end"
Example
In this example, Vector runs on a machine as EventStoreDB, collecting metrics and logs, then sending them to Datadog. Notice that despite the EventStoreDB HTTP is, in theory, accessible via localhost, it won't work if the server SSL certificate doesn't have localhost in the certificate CN or SAN.
[sources.eventstoredb_metrics]
type = "eventstoredb_metrics"
endpoint = "https://node1.esdb.acme.company:2113/stats"
scrape_interval_secs = 10

[sources.eventstoredb_logs]
type = "file"
include = ["/var/log/eventstore"]
read_from = "end"

[sinks.dd_metrics]
type = "datadog_metrics"
inputs = ["eventstoredb_metrics"]
api_key = "${DD_API_KEY}"
default_namespace = "service"

[sinks.dd_logs]
type = "datadog_logs"
inputs = ["sources.eventstoredb_logs"]
default_api_key = "${DD_API_KEY}"
compression = "gzip"
Prometheus
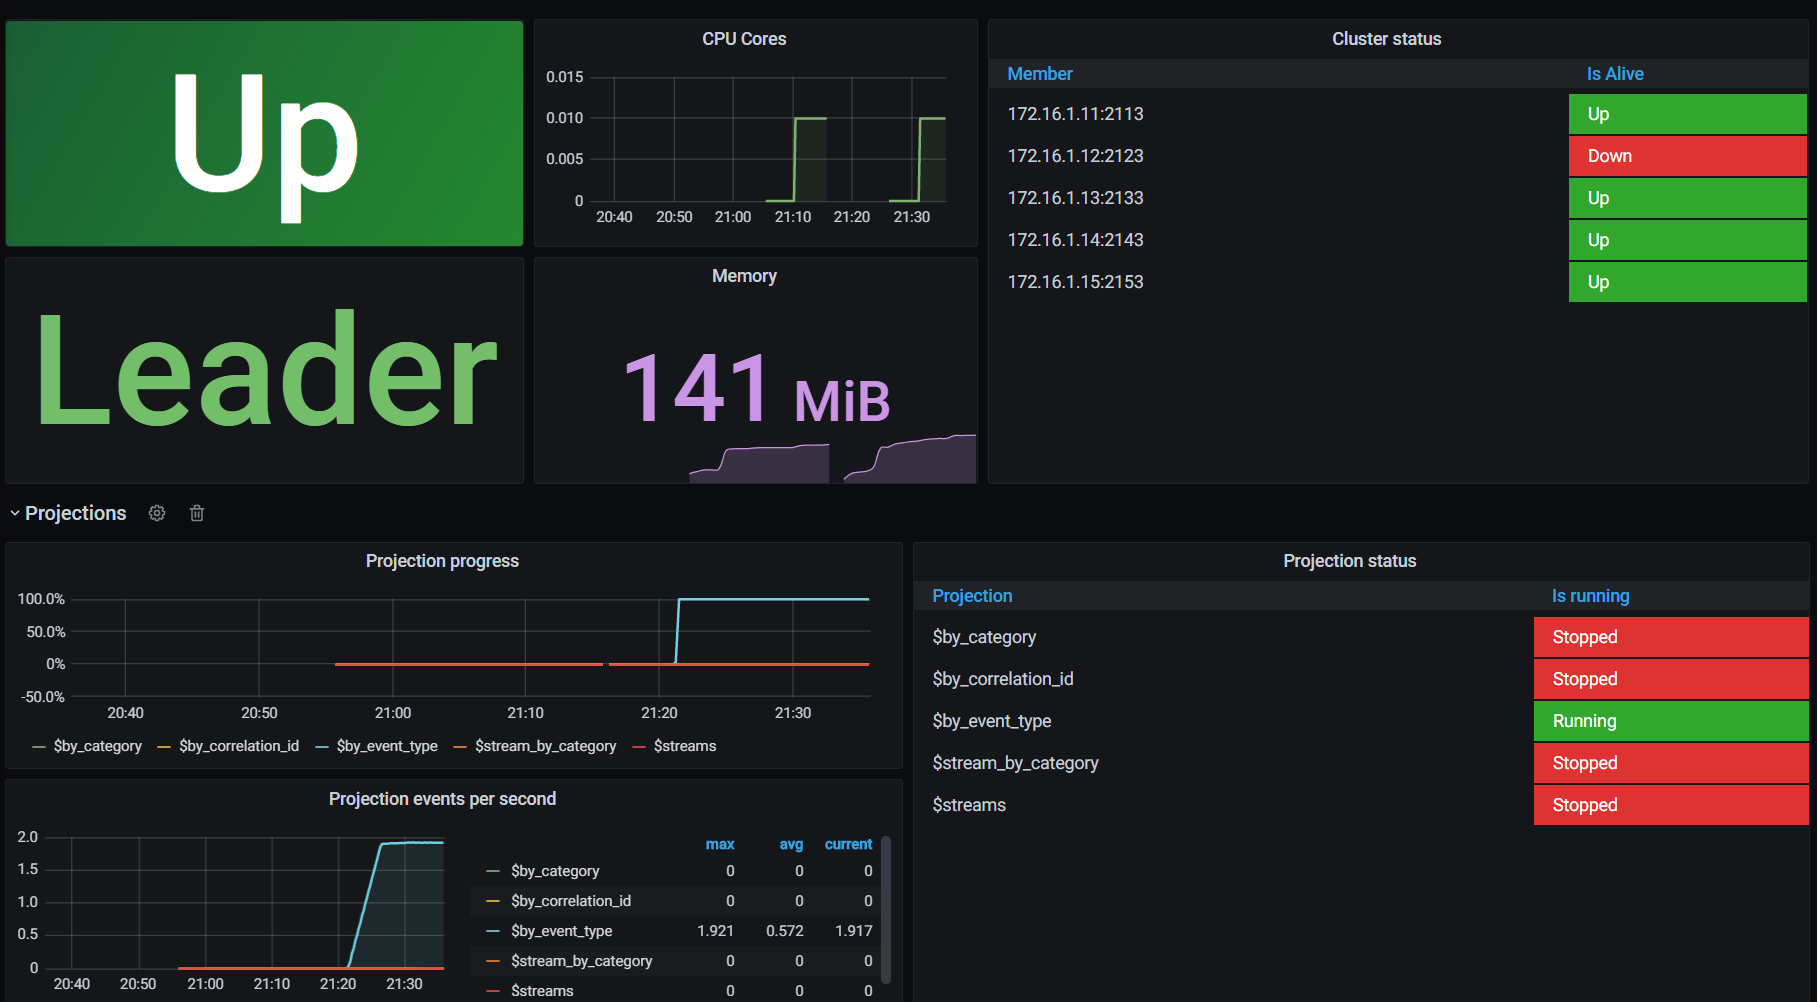
You can export EventStoreDB metrics to Prometheus and configure Grafana dashboards to monitor your deployment.
Event Store v22.10 doesn't provide Prometheus support out of the box, but you can use the community-supported exporter available in the GitHub repository.
Later versions of EventStoreDB will have Prometheus support built-in.
Datadog
Event Store doesn't provide Datadog integration out of the box, but you can use the community-supported integration to collect EventStoreDB logs and metrics in Datadog.
Find out more details about the integration in Datadog documentation.
Elastic
Elastic Stack is one of the most popular tools for ingesting and analyzing logs and statistics:
- Elasticsearch was built for advanced filtering and text analysis.
- Filebeat allow tailing files efficiently.
- Logstash enables log transformations and processing pipelines.
- Kibana is a dashboard and visualization UI for Elasticsearch data.
EventStoreDB exposes structured information through its logs and statistics, allowing straightforward integration with mentioned tooling.
Logstash
Logstash is the plugin based data processing component of the Elastic Stack which sends incoming data to Elasticsearch. It's excellent for building a text-based processing pipeline. It can also gather logs from files (although Elastic recommends now Filebeat for that, see more in the following paragraphs). Logstash needs to either be installed on the EventStoreDB node or have access to logs storage. The processing pipeline can be configured through the configuration file (e.g. logstash.conf). This file contains the three essential building blocks:
- input - source of logs, e.g. log files, system output, Filebeat.
- filter - processing pipeline, e.g. to modify, enrich, tag log data,
- output - place where we'd like to put transformed logs. Typically that contains Elasticsearch configuration.
See the sample Logstash 8.2 configuration file. It shows how to take the EventStoreDB log files, split them based on the log type (regular and stats) and output them to separate indices to Elasticsearch:
#######################################################
#  EventStoreDB logs file input
#######################################################
input {
  file {
    path => "/var/log/eventstore/*/log*.json"
    start_position => "beginning"
    codec => json
  }
}

#######################################################
#  Filter out stats from regular logs
#  add respecting field with log type
#######################################################
filter {
  # check if log path includes "log-stats"
  # so pattern for stats
  if [log][file][path] =~ "log-stats" {
    mutate {
      add_field => {
        "log_type" => "stats"
      }
    }
  }
  else {
    mutate {
      add_field => {
        "log_type" => "logs"
      }
    }
  }
}

#######################################################
#  Send logs to Elastic
#  Create separate indexes for stats and regular logs
#  using field defined in the filter transformation
#######################################################
output {
  elasticsearch {
    hosts => [ "elasticsearch:9200" ]
    index => 'eventstoredb-%{[log_type]}'
  }
}
You can play with such configuration through the sample docker-compose.
Filebeat
Logstash was the initial Elastic try to provide a log harvester tool. However, it appeared to have performance limitations. Elastic came up with the Beats family, which allows gathering data from various specialized sources (files, metrics, network data, etc.). Elastic recommends Filebeat as the log collection and shipment tool off the host servers. Filebeat uses a backpressure-sensitive protocol when sending data to Logstash or Elasticsearch to account for higher volumes of data.
Filebeat can pipe logs directly to Elasticsearch and set up a Kibana data view.
Filebeat needs to either be installed on the EventStoreDB node or have access to logs storage. The processing pipeline can be configured through the configuration file (e.g. filebeat.yml). This file contains the three essential building blocks:
- input - configuration for file source, e.g. if stored in JSON format.
- output - place where we'd like to put transformed logs, e.g. Elasticsearch, Logstash,
- setup - additional setup and simple transformations (e.g. Elasticsearch indices template, Kibana data view).
See the sample Filebeat 8.2 configuration file. It shows how to take the EventStoreDB log files, output them to Elasticsearch prefixing index with eventstoredb and create a Kibana data view:
#######################################################
#  EventStoreDB logs file input
#######################################################
filebeat.inputs:
  - type: log
    paths:
      - /var/log/eventstore/*/log*.json
    json.keys_under_root: true
    json.add_error_key: true

#######################################################
#  ElasticSearch direct output
#######################################################
output.elasticsearch:
  index: "eventstoredb-%{[agent.version]}"
  hosts: ["elasticsearch:9200"]

#######################################################
#  ElasticSearch dashboard configuration
#  (index pattern and data view)
#######################################################
setup.dashboards:
  enabled: true
  index: "eventstoredb-*"

setup.template:
  name: "eventstoredb"
  pattern: "eventstoredb-%{[agent.version]}"

#######################################################
#  Kibana dashboard configuration
#######################################################
setup.kibana:
  host: "kibana:5601"
You can play with such configuration through the sample docker-compose.
Filebeat with Logstash
Even though Filebeat can pipe logs directly to Elasticsearch and do a basic Kibana setup, you'd like to have more control and expand the processing pipeline. That's why for production, it's recommended to use both. Multiple Filebeat instances (e.g. from different EventStoreDB clusters) can collect logs and pipe them to Logstash, which will play an aggregator role. Filebeat can output logs to Logstash, and Logstash can receive and process these logs with the Beats input. Logstash can transform and route logs to Elasticsearch instance(s).
In that configuration, Filebeat should be installed on the EventStoreDB node (or have access to file logs) and define Logstash as output. See the sample Filebeat 8.2 configuration file.
#######################################################
#  EventStoreDB logs file input
#######################################################
filebeat.inputs:
  - type: log
    paths:
      - /var/log/eventstore/*/log*.json
    json.keys_under_root: true
    json.add_error_key: true

#######################################################
#  Logstash output to transform and prepare logs
#######################################################
output.logstash:
  hosts: ["logstash:5044"]
Then the sample Logstash 8.2 configuration file will look like the below. It shows how to take the EventStoreDB logs from Filebeat, split them based on the log type (regular and stats) and output them to separate indices to Elasticsearch:
#######################################################
#  Filebeat input
#######################################################
input {
  beats {
    port => 5044
  }
}

#######################################################
#  Filter out stats from regular logs
#  add respecting field with log type
#######################################################
filter {
  # check if log path includes "log-stats"
  # so pattern for stats
  if [log][file][path] =~ "log-stats" {
    mutate {
      add_field => {
        "log_type" => "stats"
      }
    }
  }
  else {
    mutate {
      add_field => {
        "log_type" => "logs"
      }
    }
  }
}

#######################################################
#  Send logs to Elastic
#  Create separate indexes for stats and regular logs
#  using field defined in the filter transformation
#######################################################
output {
  elasticsearch {
    hosts => [ "elasticsearch:9200" ]
    index => 'eventstoredb-%{[log_type]}'
  }
}
You can play with such configuration through the sample docker-compose.