Integrations
Event Store Cloud offers integrations between internal sources such as cluster health, issue detection, notifications events, EventStore DB logs, EventStore DB metrics and sinks which include external services such as Slack and Amazon CloudWatch.
Integration sources
"Sources" are driven by events or other mechanism inside the Event Store Cloud.
Currently, supported sources include:
Issues - issues represent a potentially problematic condition detected inside a cluster or other Event Store Cloud resource. Issues consist of multiple "open" events and a single "closed" event and have different levels of severity.
Logs - these are the logs generated by EventStore DB itself.
Metrics - these are the metrics generated by both EventStore Cloud issue detection processes running on each cluster node and EventStore DB itself.
Notifications - notifications are noteworthy events detected within Event Store Cloud resources or the backend. For example notifications may be emitted when a cluster fails to provision.
Issues
Issues represent possibly problematic states detected within the Event Store Cloud. Below, you can find several issue examples.
NOTE
These examples are a subset of issues created by the system. The exact details of why issues are created are subject to change, but the cause of the issue and steps to resolve it will be clear in the messages associated with the related events.
Core load count
For each node of a cluster, the core load average is measured and divided by the number of physical cores on the node. If the result exceeds 2.0 an issue is opened. This issue is closed when the result consistently dips under 2.0.
If this happens consider increasing the size of the instance type for the cluster.
Disk usage
For each node of a cluster, the disk usage is measured several times a minute. If it starts to consistently exceed 80% an issue is opened. The issue is closed when the usage drops below 80%.
If this happens consider either removing data, running scavenge or increasing the disk size for the cluster.
Memory usage
For each node of a cluster, the memory usage is measured several times a minute. If it exceeds 90% an issue is opened. The issue is closed when memory usage consistently drops below 90%.
If this happens consider increasing the size of the instance type for the cluster.
Cluster consensus
Every node on a cluster has it's gossip status queried twice each minute. An issue is opened if either the query fails or if the reported gossip state for each node is not identical on a multi-node cluster.
The issue closes when the gossip status again returns expected values.
Notifications
Notifications represent noteworthy events which occur within the Event Store Cloud. Below you can find notifications examples.
NOTE
The following represent a subset of events which can lead to notifications.
Cluster provisioning failure
If, for some reason, the instances backing a cluster fail to provision the resource is marked as defunct by the API and a notification is sent with the message Cluster instances failed to provision.
Volume expansion failure
If the volume fails to expand while expanding an instances size a notification event is created with the message Cluster volumes failed to provision.
Logs
NOTE
Logs are currently in beta. The data coming from this source may change over time.
Logs are sent in the form of JSON objects. Each object's "message" field contains the original structured event from EventStore DB itself.
Metrics
NOTE
Logs are currently in beta. The data coming from this source may change over time.
Metrics are name / value pairs generated by EventStore DB itself as well as detection processes running on the host.
Integration sinks
"Sinks" are services outside the Event Store Cloud which events from sources can be forwarded to.
AwsCloudWatchLogs - BETA Amazon CloudWatch allows you to track metrics, display them with create custom dashboards, and create alarms from them.
AwsCloudWatchMetrics - BETA Amazon CloudWatch allows for logs to be uploaded, viewed and searched, and consumed by other AWS services.
OpsGenie - OpsGenie is an alerting and incidence response tool. It is possible to set up integrations to create OpsGenie alerts when cluster health issues are detected.
Slack - Slack is a communication platform. It is possible to set up integrations which send Slack messages when issues and notifications are created or updated.
Amazon CloudWatch Logs sink
NOTE
The AwsCloudWatchLogs sink is currently in closed beta and may change over time. To access it, please contact support.
Amazon CloudWatch is a monitoring service. The "logs" portion of its functionality is separated into it's own integration in EventStore Cloud for ease of use.
You can cause all of the logs generated by each EventStore DB running in your clusters by creating a custom Amazon CloudWatch log group, an IAM user, and setting up an integration as described below.
NOTE
If you're using Terraform, instructions on how to perform the steps below can be found here.
Create new AWS resources
Create a CloudWatch Log group
In the AWS console, go to the CloudWatch page.
Make sure the region you'd like to use is selected in the upper right corner (this will ideally be the same region used by the EventStore Cloud clusters you'll be using as the source).
In the left sidebar, expand Logs and click Log groups. Then click on the button labeled Create log group.
Enter a log group. If you have multiple projects it could be a good idea to include it in the name, such as EventStoreLogs-Production.
Select a retention policy depending on your needs, any tags if necessary, and then click create.
Now find the new log group in the list, and click on it. The next page will show you it's details, including the ARN. Copy it for the next step.
Create appropriate credentials
NOTE
You should create dedicated credentials for use with the EventStore Cloud integration that only have access to the CloudWatch Log group, as shown here.
In the AWS console, go to the IAM homepage.
In the sidebar, click on Users, and then on the button labeled Add users.
Enter an appropriate name, select the AWS credential type Access key, and then click the next button.
Under set permissions, select "Attach existing policies directly". Don't click on "create policy".
Now click the next button until you get to the page titled "Review." Give the policy an appropriate name and click "Create user".
At this point copy the access key ID and secret access key as you'll need them later. Then click "close"
You should now see the users list again. Click on the newly created user.
Under the Permissions table click "Add inline policy".
On the "Create Policy" screen, click the tab labeled JSON, and then enter the following:
{
  "Version": "2012-10-17",
  "Statement": [
    {
      "Action": [
        "logs:DescribeLogGroups"
      ],
      "Effect": "Allow",
      "Resource": "${DescribeARN}"
    },
    {
      "Action": [
        "logs:CreateLogStream",
        "logs:DescribeLogStreams",
        "logs:PutLogEvents"
      ],
      "Effect": "Allow",
      "Resource": "${ARN}:*"
    }
  ]
}
2
3
4
5
6
7
8
9
10
11
12
13
14
15
16
17
18
19
20
21
Now make two replacements:
- Replace
${ARN}with the ARN you copied when you create the CloudWatch Log group in the previous step - For
${DescribeARN}, take the ARN and remove the last part before the asterisk. So for example, if the ARN isarn:aws:logs:us-west-2:123456789012:log-group:EventStoreLogs-Production:*"you'll want this value to bearn:aws:logs:us-west-2:123456789012:log-group:*".
Click on Review policy. As you can see, the recommended policy will ultimately give the integration permission to describe the log groups in your account and write to the newly create log group.
Give the policy some appropriate name, and click on "Create policy".
Add a new AwsCloudWatchLogs integration in the EventStore Cloud
- In the Event Store Cloud console, select an organization and then a project.
- Once viewing a project, you should see
Integrationsunder the headingProjectin the sidebar to the left. Click it. - Click
New Integration. Enter a name that will make it easier to find later, and then select Logs. Next select the SinkAwsCloudWatchLogsas in the screen below.
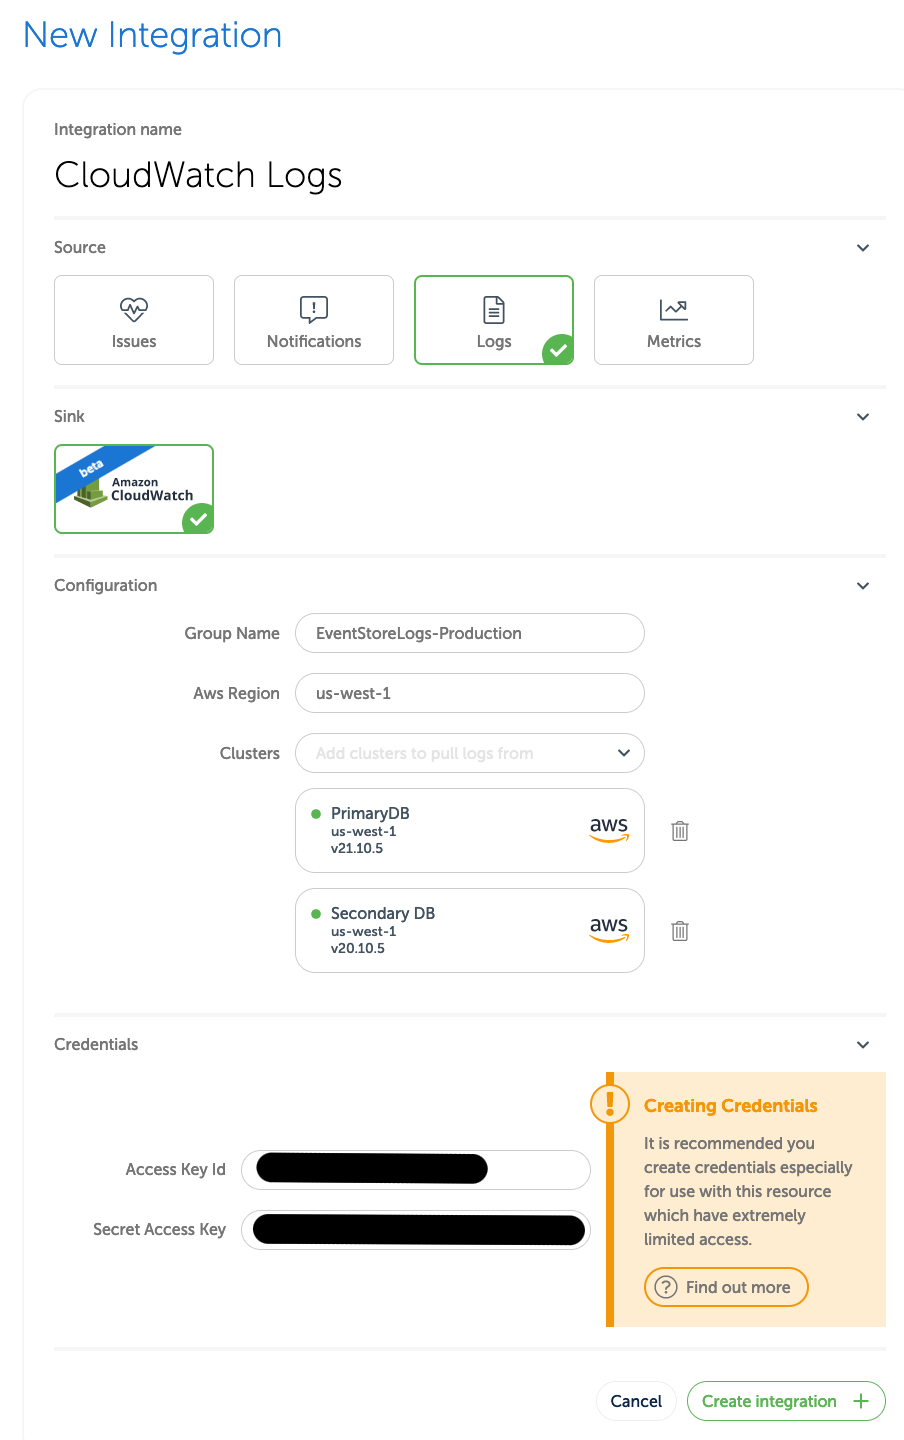
- Under
Configuration, byGroup Nameenter the name of the CloudWatch group you created earlier (for example,EventStoreLogs-Production). - Under
Configuration, byAws Regionenter the AWS region of the CloudWatch group you created earlier. - Under
Configuration, byClustersselect one or more clusters whose logs you want sent to the CloudWatch group. - Under
Credentialsenter Access Key Id which was shown when you created the IAM user earlier. - Under
Credentialsenter Secret Access Key which was shown when you created the IAM user earlier.
Testing the integration
Log integration with EventStore Cloud will take a few minutes to be fully active
If you're making sure the integration is set up correctly it's a good idea to write a few test events to the cluster. Clusters which are seeing no activity (such as dev or test clusters) will sometimes emit no logs at all.
Additionally the EventStore Cloud lacks a way to assert if the IAM credentials are valid. If no new logs appears in your Amazon CloudWatch group, please double check that the credentials given to the integration are correct and that the IAM user has the appropriate permissions.
Amazon CloudWatch Metrics sink
NOTE
The AwsCloudWatchMetrics sink is currently in closed beta and may change over time. To access it, please contact support.
Amazon CloudWatch is a monitoring service. The "metrics" portion of its functionality is separated into its own integration in EventStore Cloud for ease of use.
You can cause all of the metrics generated by each EventStore DB running in your clusters by creating a custom IAM user and setting up an integration as described below.
NOTE
If you're using Terraform, instructions on how to perform the steps below can be found here.
Create new AWS IAM resources
NOTE
You should create credentials especially for use with the EventStore Cloud integration which only have permission to perform the cloudwatch:PutMetricData action on a small set of namespaces, as shown here.
First, decide what namespace you want your EventStore DB metrics to appear under. A decent choice could be simply "EventStoreCloud".
In the AWS console, go to the IAM homepage.
In the sidebar, click on Users, and then on the button labeled Add users.
Enter an appropriate name, select the AWS credential type Access key, and then click the next button.
Under set permissions, select "Attach existing policies directly". Don't click on "create policy".
Now click the next button until you get to the page titled "Review." Give the policy an appropriate name and click "Create user".
At this point copy the access key ID and secret access key as you'll need them later. Then click "close"
You should now see the users list again. Click on the newly created user.
Under the Permissions table click "Add inline policy".
On the "Create Policy" screen, click the tab labeled JSON, and then enter the following:
{
  "Version": "2012-10-17",
  "Statement": [
    {
      "Action": [
        "cloudwatch:PutMetricData"
      ],
      "Effect": "Allow",
      "Resource": "*",
      "Condition": {
          "ForAnyValue:StringEqualsIgnoreCase": {
                "cloudwatch:namespace": [
                    "EventStoreCloud",
                    "EventStoreCloud/eventstoredb",
                    "EventStoreCloud/host"
                ]
            }
        }
    }
  ]
}
2
3
4
5
6
7
8
9
10
11
12
13
14
15
16
17
18
19
20
21
If you want to use a namespace other than EventStoreCloud, simply replace it in the policy above.
Click on Review policy.
Give the policy some appropriate name, and click on "Create policy".
Add a new AwsCloudWatchMetrics integration
- In the Event Store Cloud console, select an organization and then a project.
- Once viewing a project, you should see
Integrationsunder the headingProjectin the sidebar to the left. Click it. - Click
New Integration. Enter a name that will make it easier to find later, and then select Logs. Next select the SinkAwsCloudWatchMetricas in the screen below.
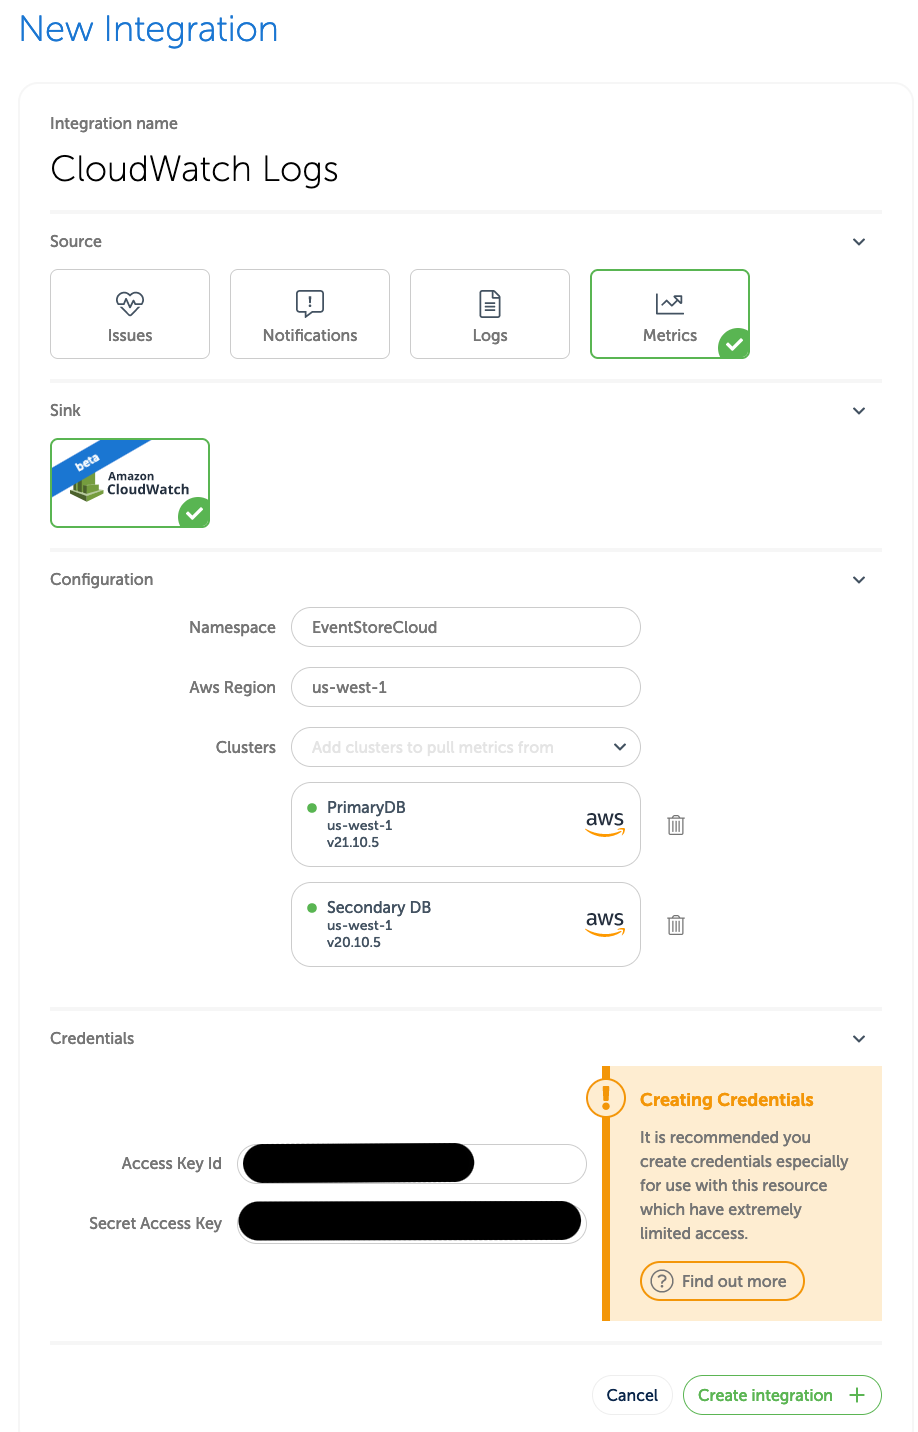
- Under
Configuration, byNamespaceenter the namespace you decided on earlier (for example,EventStoreLogs-Production). - Under
Configuration, byAws Regionenter the AWS region that matches the clusters you'll be pulling from. - Under
Configuration, byClustersselect one or more clusters whose metrics you want sent to CloudWatch. - Under
Credentialsenter Access Key Id which was shown when you created the IAM user earlier. - Under
Credentialsenter Secret Access Key which was shown when you created the IAM user earlier.
Testing the integration
Metrics integration with EventStore Cloud will take a few minutes to be fully activate
Metrics will typically appear after that without any action on your part.
Additionally the EventStore Cloud lacks a way to assert if the IAM credentials are valid. If no metrics appear under the given namespace in CloudWatch, please double check that the credentials given to the integration are correct and that the IAM user has the appropriate permissions.
Slack sink
Slack is a business communications platform.
You can be notified of new events and notifications in your Slack workspace by creating a Slack App and setting up an integration as described below.
Setup Slack
Before adding a Slack integration, you need to create a Slack App and obtain a token through slack.com.
- Go to
https://api.slack.com/appsand clickCreate New App. Give it any name you wish and select the target workspace, then clickCreate App. - On the next screen, click on
OAuth & Permissions. UnderScopes,Bot Token Scopesand add a scope ofchat:write. - At the top of the page, click
Install to Workspace. - After installing the app, the
OAuth & Permissionspage will have aBot User OAuth Tokenshown at the top. Copy it for the next step. - Finally, you'll need to invite the Slack app user to the channel you want it to chat with. In Slack, go to the appropriate channel and write the following:
/invite @<name of bot>
Add a new Slack integration
- In the Event Store Cloud console, select an organization and then a project.
- Once viewing a project, you should see
Integrationsunder the headingProjectin the sidebar to the left. Click it. - Click
New Integration. Enter a name that will make it easier to find later, and then select Issues or Notifications. Then select the SinkSlackas in the screen below.
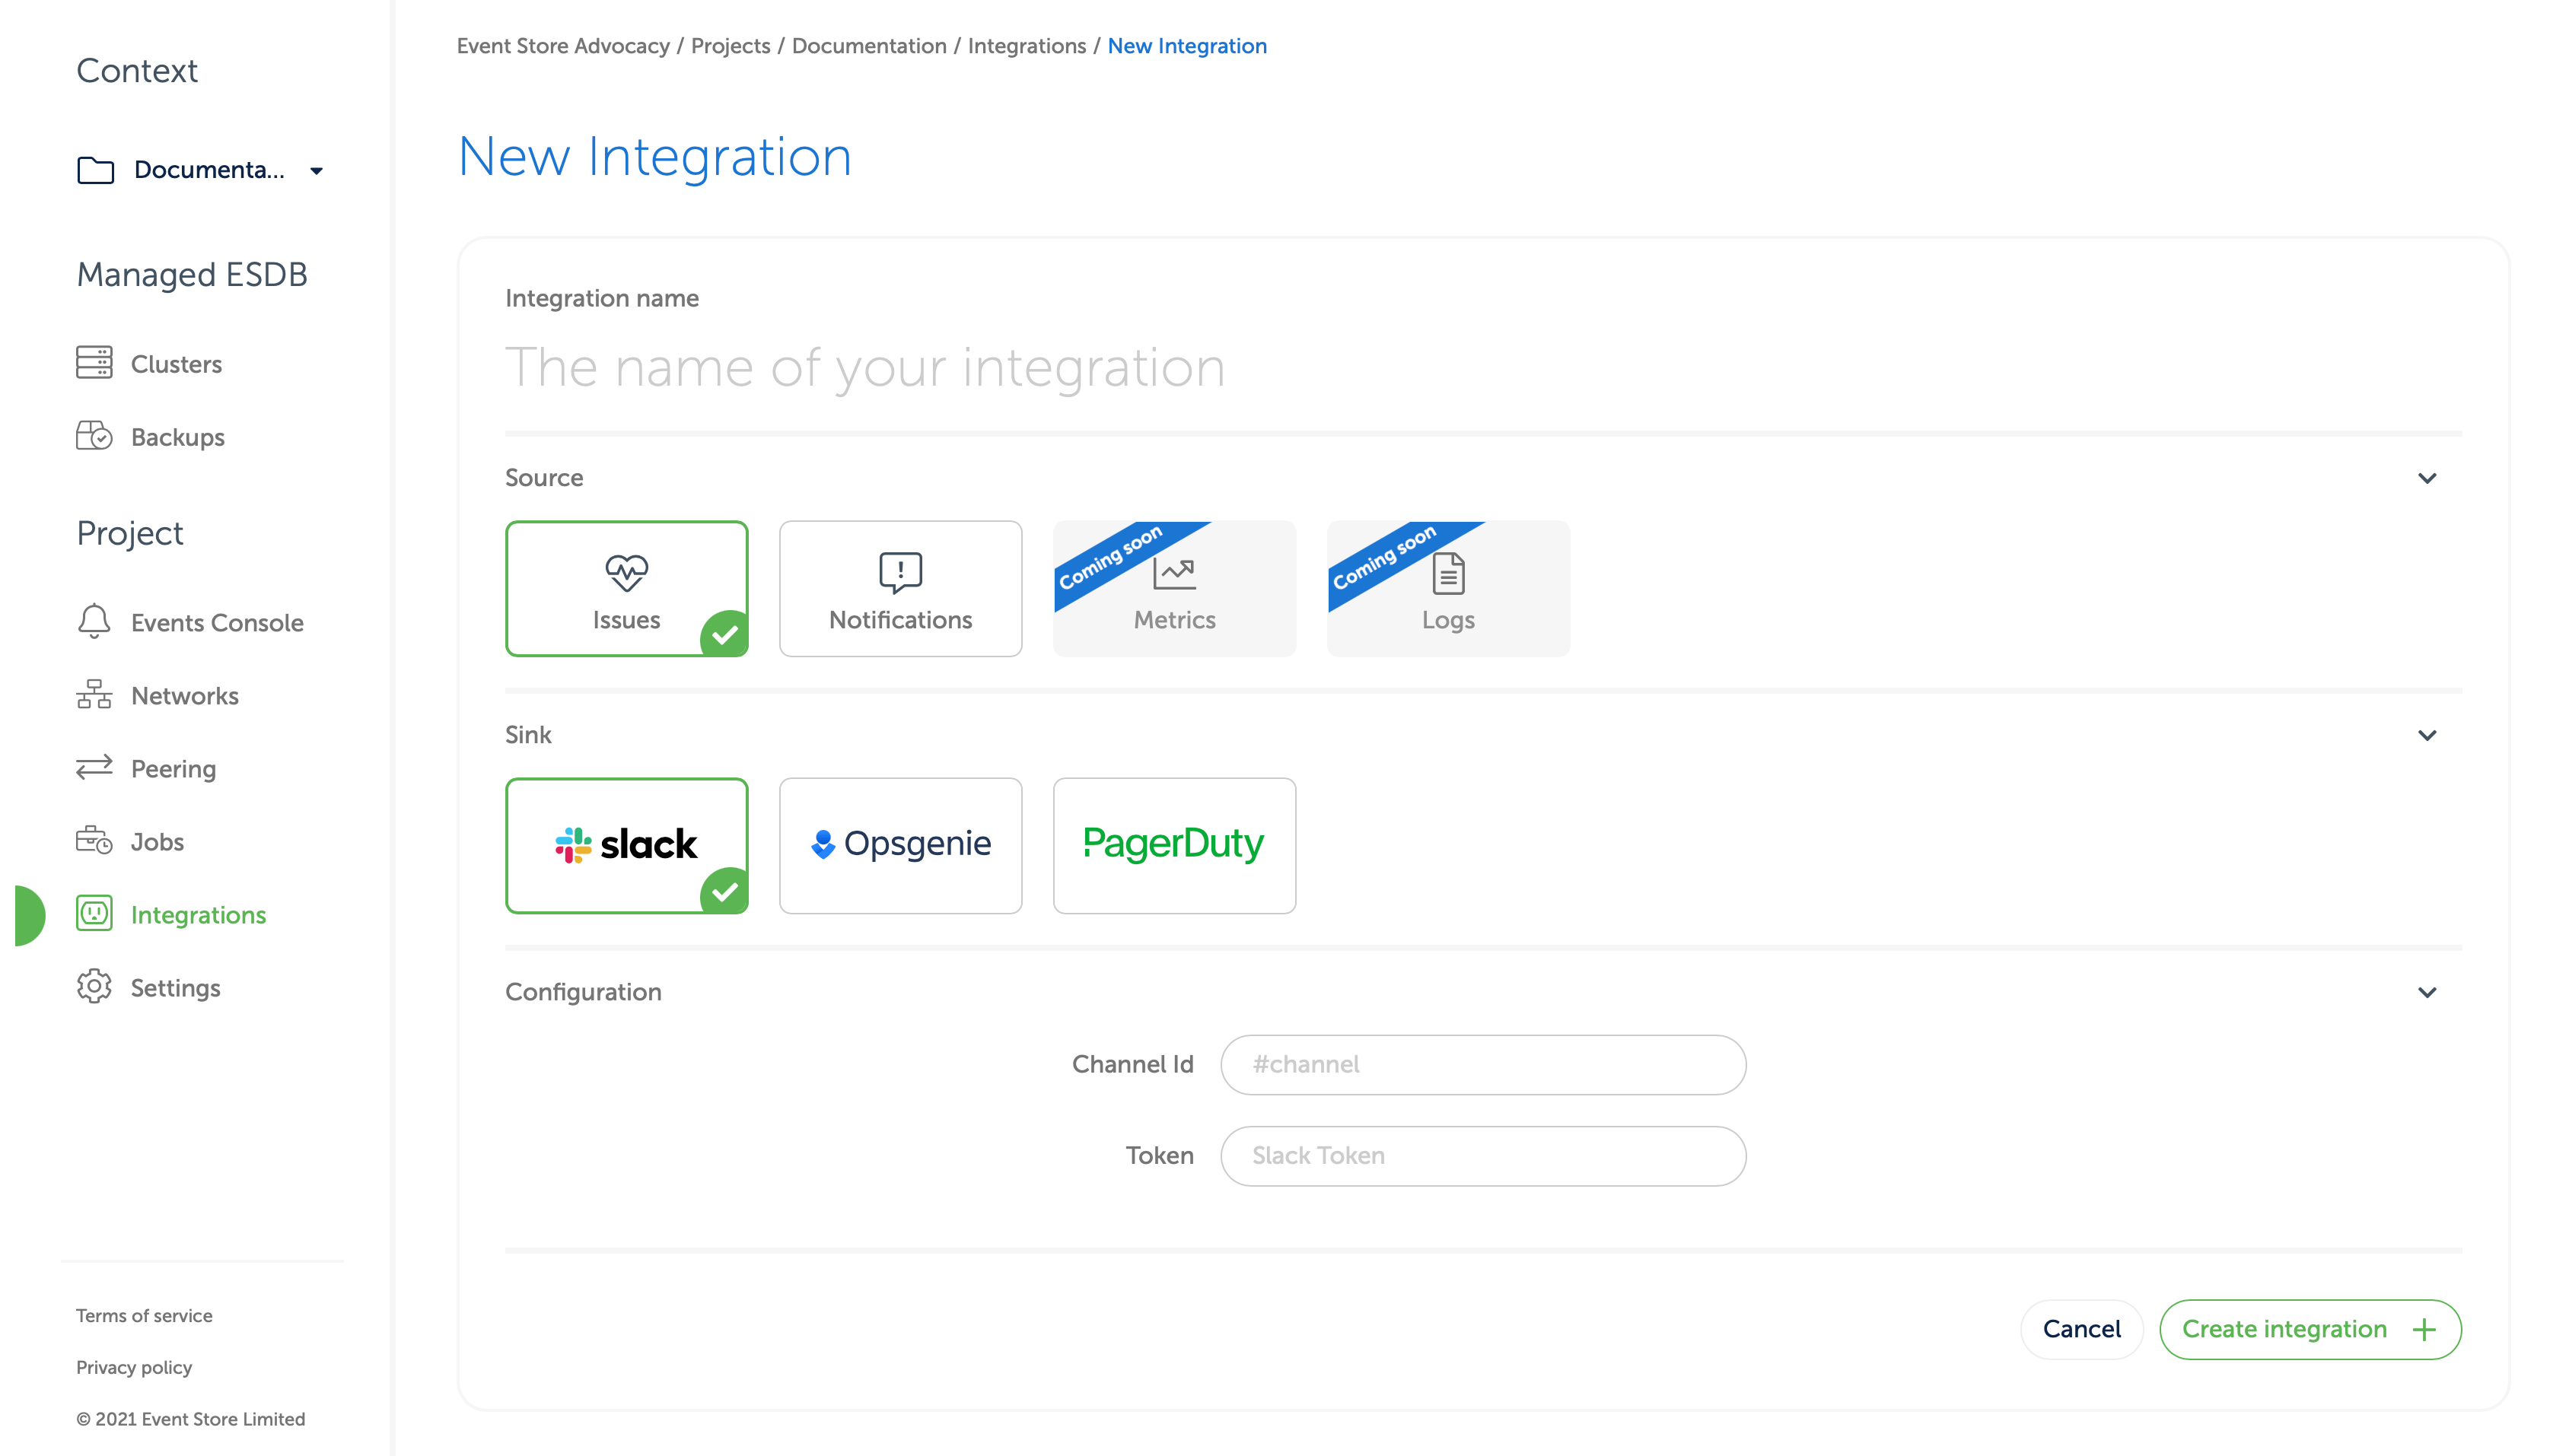
- Under
Configuration, next toChannel ID, enter the channel you want the slack bot to communicate with (this must be the same as the place you invited the bot earlier). Remember to start the channel ID with a hash sign if appropriate. - In the box next to
Tokenenter the OAuth token you copied from Slack's website. - Finally, click "Create Integration."
- Now back at the "Integrations" page, click on the row with recently created integration. In the bottom pane you should see a button marked
Test integrationas in the screen below. Click it.
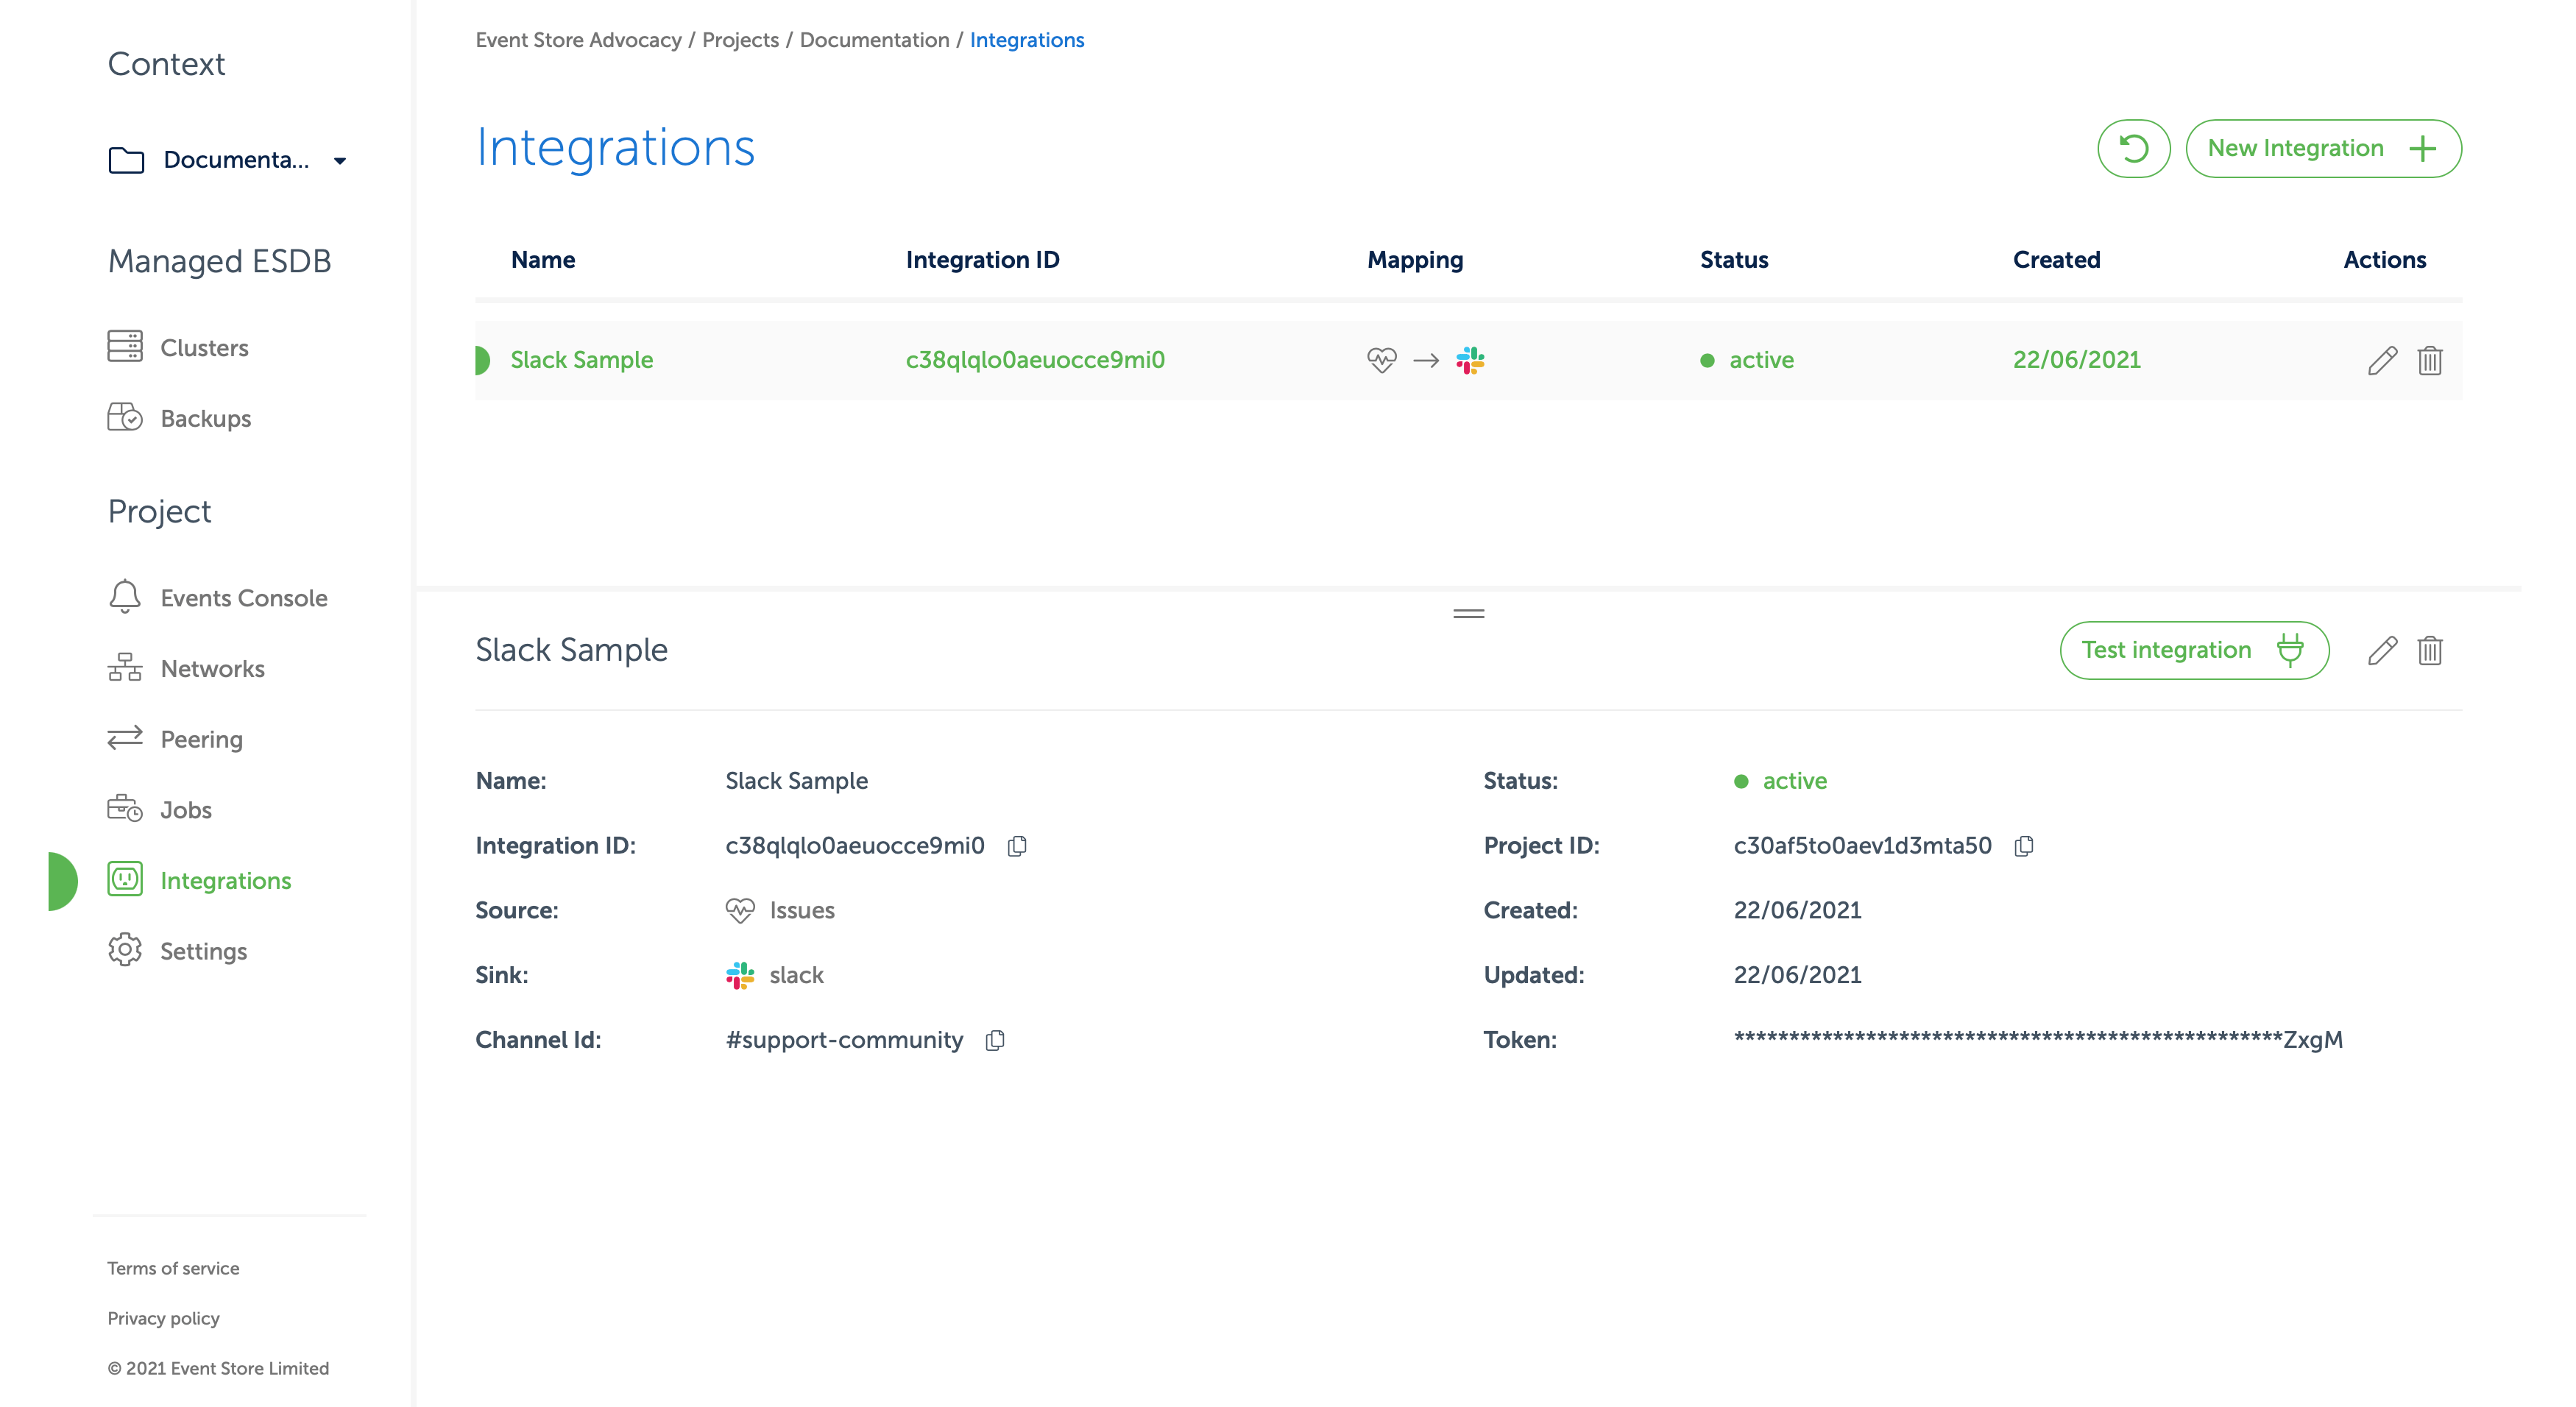
- If your Slack App was created correctly you should see a test message in the channel you selected.
- If you get an error message double check that you copied the OAuth token and Channel ID into the integration correctly. You may also wish to review the previous step to ensure you gave the app appropriate permissions. You can edit the integration by clicking on the pencil icon in its row.
- If you see a Slack message, you can rest you will receive events from the configured source when they occur.
Details
If the source is Notifications, a single message will be sent to the configured slack bot for each notification.
If the source is Issues, a single message will be sent for each open issue and given a red bar. Open issues receive new events continuously, however the original Slack message will only be updated to reflect the latest event every five minutes.
When the issue is closed, the original message will be changed to reflect this, and the bar will be changed to green.
In order to send messages to multiple channels, create more integrations in Event Store Cloud using the same credentials.
OpsGenie sink
EventStore Cloud platform is using OpsGenie for its alerting system. Our minimal configuration requires an API key. For simplicity’ sake, we recommend the API key to belong to a responder team.
Those instructions assume you are starting from scratch and don't have a team set up yet. We also assume that you are currently on the landing page after logging in OpsGenie.
Create a team in OpsGenie
Log in to your OpsGenie instance, then complete the following steps to set up a new team. Skip this step if you already have a team.
- Click on the
Teamstab up top. - Click on the
Add teamtop left. - A popup should show up. Enter your team info like its name and members. Keep in mind that the team will be considered as the responder team in EventStore Cloud.
- Once you confirm your new team creation, you should be redirected to your new team dashboard page.
Generate the team API key
Follow these steps to generate an API key for the team, which should be alerted when issues happen in Event Store Cloud.
- Click on the
Teamstab up top. - Select your team in the team table.
- By selecting your team, you should be redirected to your team dashboard.
- Click on
Integrations, located in the left sidebar. - Click on the
Add integrationbutton. - In the integration list, click on
APIthen theAddbutton. - By default, the form should be already pre-filled. Make sure that
Read Access,Create and Update Access,Delete AccessandEnabledare checked. - Click on
Save Integrationat the bottom. - You can get your API key that should be located just below the
Nameproperty.
Complete the integration
- In the Event Store Cloud console, select an organization and then a project.
- Once viewing a project, you should see
Integrationsunder the headingProjectin the sidebar to the left. Click it. - Click
New Integration. Enter a name that will make it easier to find later, and then select Issues or Notifications. - Select the OpsGenie sink and put the API Key as in the screen below:
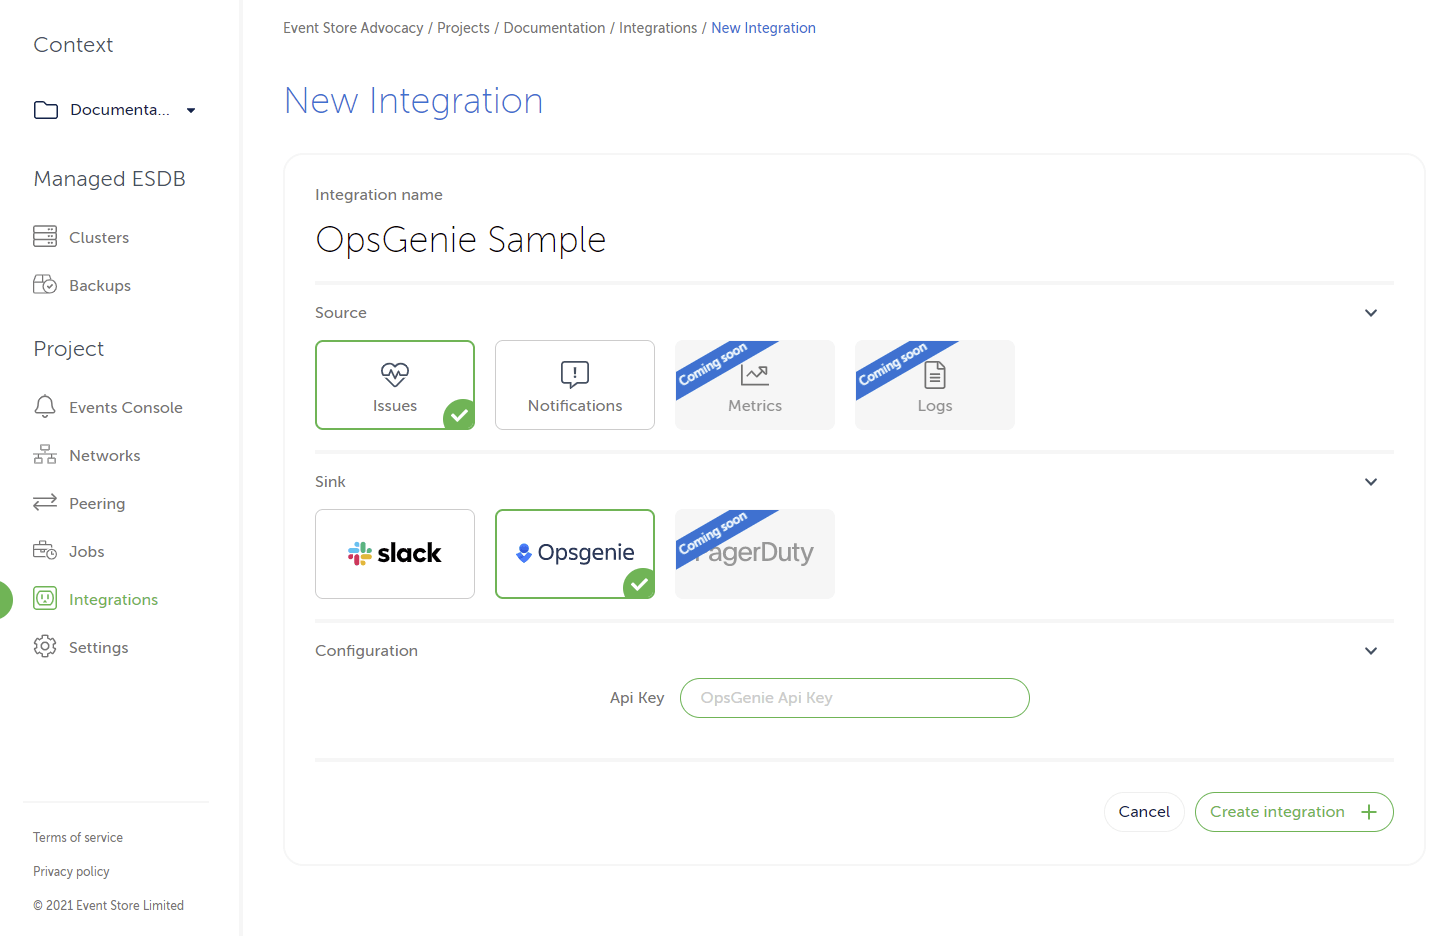
and click on the Create integration button.
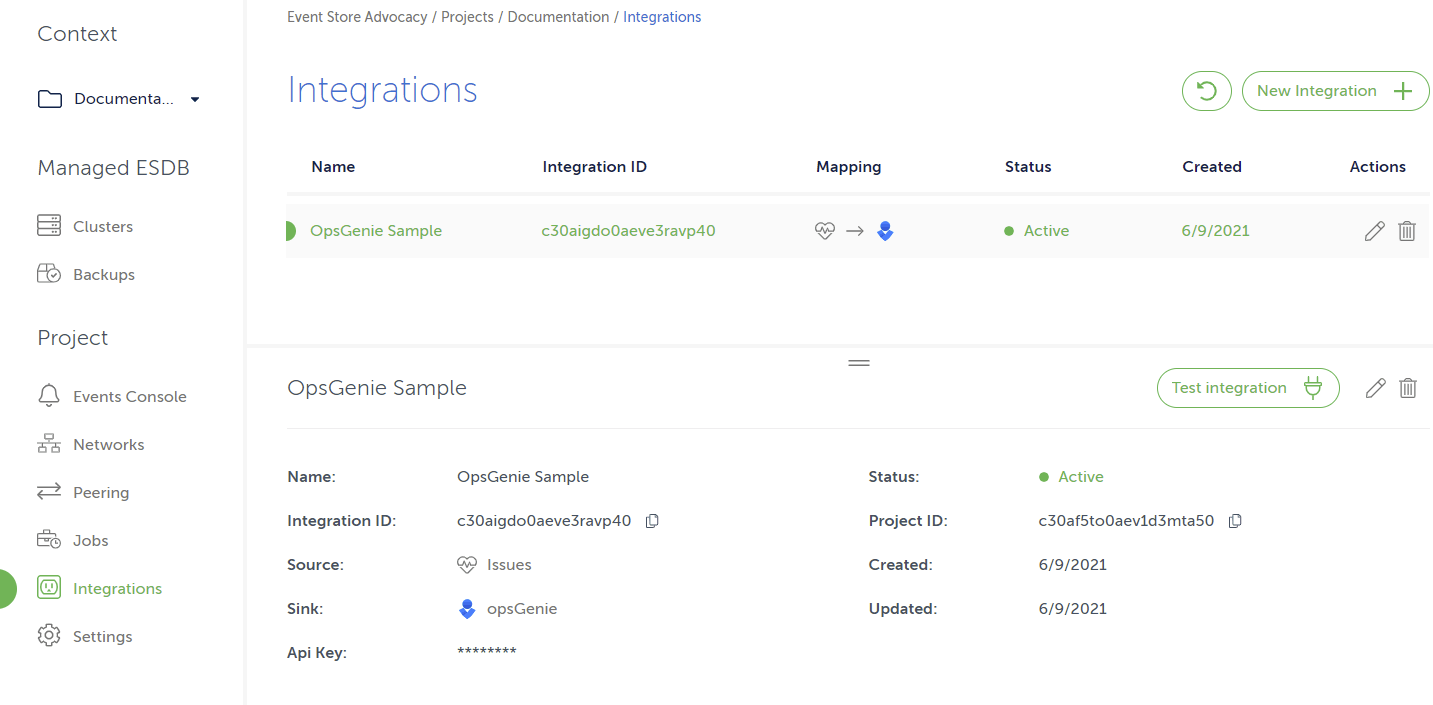
If all the details were entered correctly, the new integration should be set up. See the example on the screen below.